Hi Rick,
Thanks for the feedback. Would you mind posting a screenshot of exactly the view you are talking about. Ideally, you could use an image editor to show exactly what you would like to see instead of what you see now.
I think I understand, but the image would definitely help.
Thanks again for your interest in using the new Skyline small molecule support.
--Brendan |
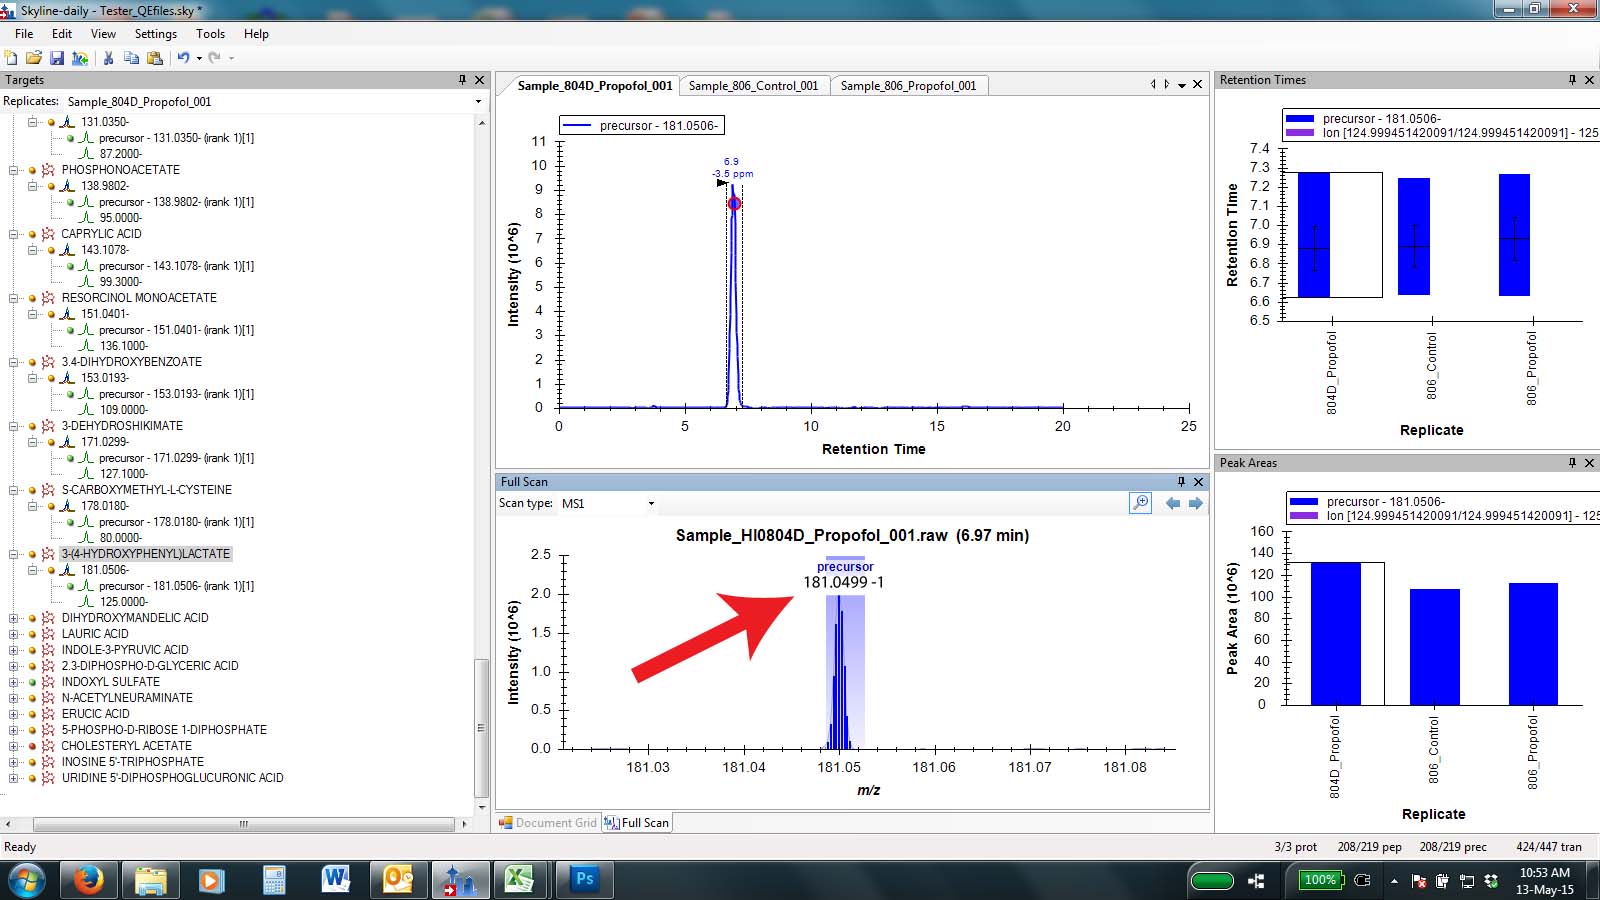
Hi Rick,
Thanks. Pretty much what I imagined. One more question, though: would the m/z value be the raw m/z of the most intense point within the extraction range, or would it be the central m/z from which the PPM mass delta is calculated. They are not the same thing. Although, I think the first option makes a lot of sense, I worry that it will confuse people who try to verify the PPM mass delta by comparing this annotation m/z with the target m/z.
Any further thoughts on this? I suppose we can have the option to display either or both.
--Brendan |
 msscan_001.jpg